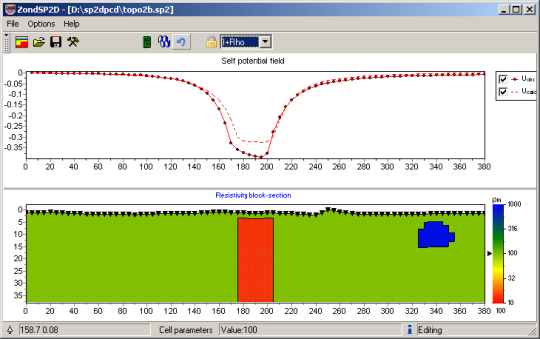
ZondSP2d — Potentiel spontané 2D
Le logiciel ZondSP2d est conçu pour l'interprétation 2D des données de potentiel spontané (SP).
La méthode SP repose sur l'étude des champs électriques qui se produisent dans les roches en raison de divers processus physiques et chimiques. Dans presque tous les contextes géologiques, il existe des potentiels spontanés de nature diffusivo-absorbante et de filtrage. Et au-dessus des roches sulfidées et graphitisées, on peut trouver des champs beaucoup plus intenses de nature redox. ZondSP2d permet d'interpréter différents types de sources de champs naturels. Le choix du type de source dépend de la tâche à accomplir :
- Source de bord de nature redox apparaissant à la frontière entre les conducteurs électroniques et ioniques, par changement de saut de barrière à cette frontière,
- Source volumique pouvant être spécifiée par des dipôles verticaux ou horizontaux, des sources ponctuelles, ainsi que des dipôles de direction arbitraire.

- Prise en charge de toutes les configurations et de leurs combinaisons avec des lignes de configuration de gradient et de potentiel arbitraires
- Importation des données de terrain à partir de fichiers texte et Excel
- Prise en compte de la topographie
- Construction d'une section géoélectrique basée sur des modèles polygonaux ou maillés
- Importation de modèles de résistivité à partir des programmes : ZondIP1d, ZondRes2D, ZondMT1D, ZondMT2D, ZondTEM1d, ZondTEM2d
- Modélisation polygonale des volumes et des frontières des sources
- Algorithmes d'inversion : statistiques, Occam avec réglages de lissage, d'intensité, de résolution ; robustes et paramétriques
- Mémoire tampon avec jusqu'à 5 modèles
- Algorithme d'approximation des champs naturels observés par un ensemble d'objets allongés de différentes géométries avec distribution linéaire des sources le long de la direction
- Différentes options de visualisation des données de champ, des modèles et des informations a priori
- Visualisation 3D des sections sur un réseau de profils arbitraires avec construction de sections à différentes profondeurs
- Exportation vers des formats graphiques raster et vectoriels, Excel, Surfer, GeoSoft, AUTOCAD.

ZondSP2D appartient à la famille des programmes Zond. Une interface unifiée et une approche de traitement des données rendent facile la prise en main de l'ensemble du package – à condition que vous maîtrisiez l'un des programmes. Cette approche permet aux interprètes de compiler des données géophysiques issues de différentes méthodes, ce qui conduit à un modèle géologique et géophysique plus stable et fiable.
Famille de logiciels Zond :| ZondIP1d |
Conçu pour l'inversion 1D des données SEV et SEV-IP |
| ZondRes2d |
Conçu pour l'interprétation 2D des données de résistivité et de polarisation induite en variantes terrestres, en forage et marines |
| ZondRes3d |
Conçu pour l'inversion 3D des données de résistivité et de polarisation induite en variantes terrestres, en forage et marines |
| ZondProtocol |
Conçu pour la création de protocoles, le contrôle des mesures et la visualisation des mesures ERT ainsi que l'évaluation de la qualité des données |
| ZondMT1D |
Conçu pour l'interprétation 1D des données de magnétotellurique (MT), audiomagnétotellurique (AMT) et radiomagnétotellurique (RMT) |
| ZondMT2D |
Conçu pour l'interprétation 2D des données de MT, AMT et RMT |
| ZondGM2d |
Conçu pour l'interprétation multiprofil 2D des données gravimétriques et magnétiques |
| ZondGM3d | Conçu pour l'interprétation 3D des données gravimétriques et magnétiques |
| ZondTEM1d |
Conçu pour l'interprétation 1D des données électromagnétiques transitoires (TEM) pour des lignes et des boucles |
| ZondTEM2d |
Conçu pour l'inversion 2D des données de sondages EM dans les domaines temporel et fréquentiel |
| ZondST2d |
Conçu pour l'interprétation 2D des données de tomographie sismique (premiers temps d'arrivée) et sismique de réfraction |
| ZondST3d |
Conçu pour l'interprétation 3D des données de tomographie sismique (premiers temps d'arrivée) et sismique de réfraction |
| ZCGViewer |
Conçu pour le calcul et la visualisation des graphes de résistivité apparente obtenus avec divers systèmes de prospection électrique |


